Short answer
Candlestick patterns are shapes made by one to three price candles, such as the doji, the hammer or the engulfing pattern, that show how buyers and sellers pushed the price around during a period. They only carry weight in context, for example at a support or resistance level and in the direction of the trend, and even then they often fail. Learn to read them on a demo account and treat each one as a reason to look closer, not as a reason to trade.
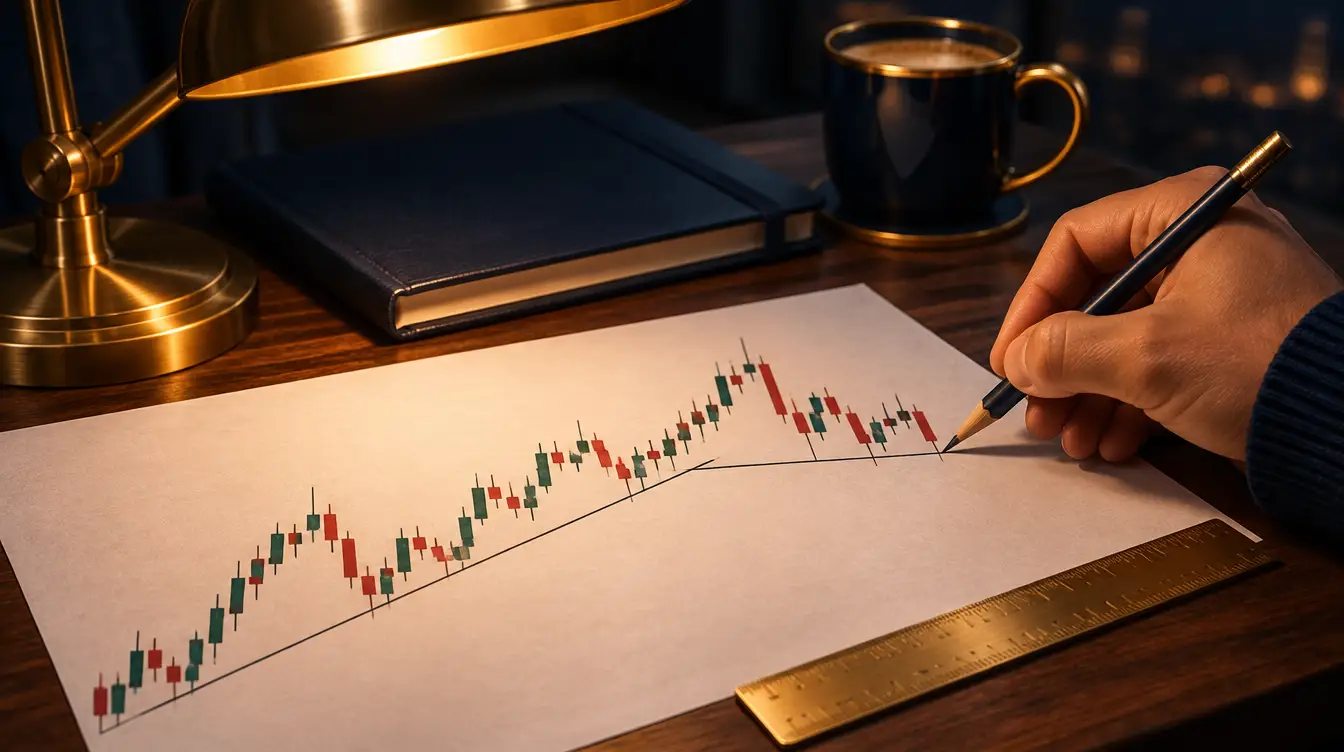
How to read a candlestick
Live chart: EURUSD
Technical indicators, live
Automated reading, not advice
On this page
- What technical analysis can and can’t do
- How to read a candlestick
- Single candlestick patterns: doji, hammer and shooting star
- Patterns with two or three candles
- Support and resistance
- Trend and trendlines
- Timeframes and what each candle covers
- Moving averages, RSI and MACD in plain words
- Price action: putting candles, levels and trend together
- How candlestick patterns fail
- How to practise technical analysis on a demo account
- What to do next
Candlestick patterns are the first thing most people meet on a forex chart, and the easiest part of technical analysis to learn badly. A hammer or an engulfing candle looks convincing in a screenshot shared in a Telegram group, because the screenshot was chosen after the move had happened. This guide explains what each candle shows, the patterns worth knowing, how support, resistance, trend and timeframes change their meaning, and how patterns fail. Every price below is an example, not a forecast or a recommendation.
What technical analysis can and can’t do
Technical analysis is the study of past prices on a chart. It assumes that the way buyers and sellers behaved around certain prices says something about how they might behave there again. It doesn’t read interest rates or economic reports directly; it reads the footprints they leave in the price.
Used well, it answers practical questions: where a trade idea would be wrong, how far the price might travel before it meets an old level, and whether the market is trending or moving sideways. That is what you need to place a stop loss and size a position.
It can’t tell you what will happen next. A chart has no idea that the US jobs report is due at 14:30 WAT, and patterns that worked for weeks stop working without warning. What you get is a set of probabilities and a clear place to admit you were wrong, never certainty.
Forex is traded with leverage, so a small move against a large position can take a big bite out of a small account within minutes. Read leverage and margin before you trade from a chart, and do your first few dozen trades on a demo account.
How to read a candlestick
Each candle summarises trading over one period, whatever timeframe the chart is set to. It records four prices: the open, the high, the low and the close.
The thick part is the body, between the open and the close. The thin lines above and below are the wicks, or shadows, which show how far the price travelled before it was pushed back. If the close is above the open, the candle is bullish, usually drawn green or white. If it closes below the open, it is bearish, usually red or black. Colours are a chart setting, so check yours.
A worked example: reading one candle
Here is a 1-hour EURUSD candle with example prices:
| Price | Value |
|---|---|
| Open | 1.08420 |
| High | 1.08610 |
| Low | 1.08350 |
| Close | 1.08570 |
The close is above the open, so the candle is bullish. The body (1.08420 to 1.08570) is 15 pips, the upper wick 4 pips and the lower wick 7 pips. In plain words: sellers pushed the price 7 pips below the open, buyers then lifted it 26 pips from the low to the high, and it closed 4 pips below the high. If the pip arithmetic is new, what is a pip covers it.
In MetaTrader, Alt+2 switches a chart to candlesticks (Alt+1 gives bars, Alt+3 a line). On the phone app, the chart type sits in the chart settings. Our guide to forex trading apps covers the rest of the platform.
Single candlestick patterns: doji, hammer and shooting star
A single candle can show a shift in who was in control during that period. On its own, it shows nothing more.
Doji
A doji opens and closes at, or very near, the same price, so its body is a thin line. It records a period in which neither side won. After a long run up or down, traders read it as a sign that the move is losing momentum. In a sideways market it means very little, because the market was already undecided.
Hammer
A hammer has a small body near the top, a lower wick at least twice the length of the body, and little or no upper wick. It forms after a fall: sellers pushed the price well down, buyers pushed it back, and the candle closed near its high. The same shape after a rise is called a hanging man and is read the other way, as a hint that buyers are tiring.
Shooting star
The shooting star is the hammer turned upside down: a small body near the bottom and a long upper wick, after a rise. Buyers tried to push higher and were rejected. The same shape after a fall is called an inverted hammer.
The meaning of all three depends on where they appear. A hammer at the end of a long fall, on a level where the price has turned before, deserves a closer look; one in the middle of a choppy range doesn’t.
Patterns with two or three candles
The bullish engulfing pattern is a bearish candle followed by a bullish candle whose body completely covers the first one’s body. The bearish engulfing pattern is the mirror image. The bigger the second body compared with the first, the more attention traders give it.
The morning star has three candles: a long bearish candle, a small candle (often a doji) showing that the selling has stalled, then a long bullish candle that closes well into the first candle’s body. The evening star is the same thing upside down, at the top of a rise. In stock markets the middle candle often gaps away from the others; forex trades around the clock on weekdays, so its candles usually join up.
The inside bar is a candle whose high and low both sit inside the range of the candle before it, the mother bar. The range is shrinking while the market waits for something, and the pattern doesn’t say which way the price will leave. Many traders mark the mother bar’s high and low and watch for a break of either, knowing that the first break is often false.
| Pattern | Candles | What it describes | Where traders look for it | How it commonly fails |
|---|---|---|---|---|
| Doji | 1 | Indecision: open and close almost equal | After a long move, at a level | In a sideways market it means nothing |
| Hammer | 1 | Sellers pushed down, buyers took it back | After a fall, at support | The next candles break below the hammer’s low |
| Shooting star | 1 | Buyers pushed up, sellers took it back | After a rise, at resistance | The next candles close above the wick |
| Engulfing (bullish or bearish) | 2 | One side overwhelmed the other for a period | At the end of a move, at a level | The old trend resumes within a few candles, often on news |
| Morning or evening star | 3 | A move stalls, then turns | After a clear trend, at a level | The price returns to the old trend after the third candle |
| Inside bar | 2 | The range is shrinking; the market is waiting | Anywhere, often before news | It breaks one way, then reverses through the other side |
Support and resistance
Support is a price area where falls have stopped before, because buyers stepped in. Resistance is an area where rises have stalled, because sellers took over. These levels are the context that makes a candle worth looking at.
To find them, open the daily or 4-hour chart and look for prices where the market turned more than once. Draw a zone around those turns rather than a thin line, because the market rarely stops at exactly the same price twice. Round numbers often matter too, such as 1.1000 on EURUSD or 4,000.00 on gold, because orders cluster around them. When support breaks, it often acts as resistance later, and the other way round; traders call this role reversal.
A level on the daily chart counts for more than one on the 5-minute chart, and a level respected three times counts for more than one touched once.
A worked example: a hammer at gold support
These prices are examples. Gold (XAUUSD) has turned up three times from the 3,980 to 3,990 area on the 4-hour chart. It falls into that zone again and prints a hammer with a low of 3,982.00 and a close of 3,996.00. A trader in Johannesburg has a USD 200 account, about R3,600 at an example rate of R18 to the dollar.
- Entry near the close: 3,996.00.
- Stop loss a little below the hammer’s low, at 3,980.00: a USD 16 move.
- On gold, 0.01 lots is 1 ounce, so each USD 1 move in the price is worth USD 1.
- Loss at the stop: 16 × USD 1 = USD 16, about R288. That is 8% of the account on one trade.
That is far more than most risk guidelines allow, and 0.01 lots is usually the smallest size a standard account accepts, so this setup is too big for this account however neat the hammer looks. The options are a cent account, which accepts sizes far below 0.01 lots, or letting the trade go. The gold lot size calculator does this sum for any balance, and how to trade gold explains gold’s contract sizes.
Trend and trendlines
An uptrend is a series of higher highs and higher lows: each rise goes further than the last, and each dip stops above the previous one. A downtrend is the reverse. When highs and lows overlap without direction, the market is ranging.
In an uptrend, a trendline joins two or more of the rising lows; in a downtrend, the falling highs. Any two points make a line, so traders take a trendline seriously only after a third touch. Draw it across the wicks or across the bodies, but keep to one method, because the choice moves the line.
A bullish engulfing pattern at support in an uptrend agrees with the bigger picture. The same pattern in a strong downtrend goes against it, and those fail more often because the larger flow of orders is heading the other way. A broken trendline doesn’t prove the trend has reversed, either; often the market just moves sideways for a while.
Timeframes and what each candle covers
The timeframe sets how much trading goes into each candle. MetaTrader 4 offers nine standard timeframes and MetaTrader 5 twenty-one, as our trading platforms guide explains.
| Timeframe | One candle covers | Candles in a 24-hour trading day | Typical use |
|---|---|---|---|
| M1, M5 | 1 or 5 minutes | 1,440 or 288 | Very short trades; the most noise |
| M15, M30 | 15 or 30 minutes | 96 or 48 | Trades opened and closed the same day |
| H1 | 1 hour | 24 | Same-day trades and short swings |
| H4 | 4 hours | 6 | Swing trades lasting a few days |
| D1 | 1 day | 1 | The trend and major levels |
| W1, MN | 1 week or 1 month | Less than one | The big picture |
A daily candle contains a full day of trading. A 1-minute candle can be shaped by one large order or a brief widening of the spread, which is why short-timeframe patterns fail more often.
Many traders work from the top down: the daily chart for the trend and major levels, then the 4-hour or 1-hour chart for patterns at those levels. Flicking between six charts until one shows the pattern you hoped for is a reliable way to fool yourself.
A daily candle opens and closes at midnight on the broker’s server clock, which is usually not midnight where you live. The forex trading hours page converts the sessions into WAT, SAST and EAT.
Moving averages, RSI and MACD in plain words
Indicators are calculations from past prices that rearrange what the candles already show. Three are worth knowing first.
A moving average (MA) is the average closing price of the last N candles, drawn as a line. A 50-period MA on the daily chart covers about ten weeks of trading days, a 200-period MA about nine months. Price above a rising MA suggests an uptrend; below a falling one, a downtrend. When a short MA crosses a long one, traders call it a crossover. Because averages are built from old prices, crossovers come late, often after much of the move.
The Relative Strength Index (RSI), usually set to 14 periods, compares recent rises with recent falls on a scale from 0 to 100. Above 70 is called overbought, below 30 oversold. In a strong trend the RSI can stay above 70 for a long time while the price keeps rising, so overbought doesn’t mean about to fall.
MACD, usually set to 12, 26 and 9, measures the gap between two exponential moving averages and compares it with its own average, the signal line. A cross above the signal line means momentum is turning up; a cross below, turning down. Like the MA, it lags.
Our live technical signals page shows how these indicators currently score on the major pairs and gold, and why those scores are often wrong. Most indicators are built from the same closing prices, so adding more of them mostly repeats the same information.
Price action: putting candles, levels and trend together
Price action trading means reading the chart itself, candles, levels and trend, with few or no indicators. In practice it comes down to a short checklist:
- What is the trend on the higher timeframe?
- Is the price at a support or resistance zone that has mattered before?
- Has a pattern formed at that zone, in the direction of the trend?
- Where would the idea be wrong, and is that stop distance affordable at the smallest size?
- Is high-impact news due in the next hour? The economic calendar shows it in your local time.
If any answer is no or unclear, a disciplined trader waits, and on most days at least one of them is.
A worked example: sizing a trade from the chart
Example prices again. EURUSD is in an uptrend on the daily chart. On the 4-hour chart the price dips into a support zone at 1.0840 to 1.0850 and forms a bullish engulfing pattern closing at 1.0872, with a low of 1.0838.
A trader in Lagos has NGN 300,000 in the account, about USD 200 at an example rate of NGN 1,500 to the dollar, and wants to lose no more than 1%, USD 2, if the idea fails.
- Stop a little below the pattern’s low, at 1.0832: 40 pips from 1.0872.
- USD 2 ÷ 40 pips = USD 0.05 per pip.
- On EURUSD, 0.01 lots is worth USD 0.10 per pip, so the trade would need 0.005 lots.
That is below the usual 0.01 minimum. At 0.01 lots, the loss at the stop would be USD 4, about NGN 6,000, or 2% of the account. The trader can accept 2%, use a cent account, or wait for a setup with a tighter natural stop. Shrinking the stop to 20 pips just to make the size fit puts it inside the market’s normal noise, where it gets hit for no reason. The lot size calculator does this arithmetic for you.
How candlestick patterns fail
Every pattern on this page fails regularly, and knowing how is more useful than memorising twenty more patterns.
A worked example: the hammer that didn’t hold
Example prices. GBPUSD falls to a support zone around 1.2650 and prints a neat hammer on the 1-hour chart, with a low of 1.2641 and a close of 1.2668. A trader in Nairobi with KES 26,000, about USD 200 at an example rate of KES 130 to the dollar, buys 0.01 lots at 1.2668 with a stop at 1.2635, 33 pips away. The planned loss is 33 × USD 0.10 = USD 3.30, about KES 430.
Forty minutes later, US jobs figures come out stronger than forecast. GBPUSD drops 70 pips in two minutes and the spread widens. The stop is triggered but filled at 1.2626, 9 pips worse than planned, so the loss is USD 4.20 instead of USD 3.30. The hammer was a textbook shape; it had no say over a scheduled release the trader hadn’t checked.
The common ways patterns fail:
- News overrides charts. Rate decisions, inflation figures and jobs reports move prices further and faster than any candle shape allows for.
- False breakouts. The price breaks a level or an inside bar’s range, draws traders in, then reverses through the other side.
- Quiet hours. When London and New York are closed, spreads are wider and a few orders can draw candles that look like patterns, especially around the daily rollover at 17:00 New York time.
- Weekend gaps. Monday’s first price can jump straight past a stop set on Friday.
- Hindsight. Patterns are easy to see on old charts because you know what came next. On the right-hand edge of a live chart, the same candle is far less clear.
- Seeing what you want. If you already want to buy, every long lower wick starts to look like a hammer.
A stop loss doesn’t stop a pattern failing; it limits what the failure costs. Because it can be filled at a worse price in a gap or a fast market, size positions as if the loss may be a little larger than planned.
How to practise technical analysis on a demo account
A demo account uses virtual money on real prices, so it is the place to find out if you can spot these patterns live and act on them calmly. A simple routine:
- Choose one market, such as EURUSD or gold, and two timeframes, such as daily and 4-hour.
- Mark support and resistance zones on the daily chart before the week starts.
- Write your rules down: which patterns, at which levels, where the stop goes, what size.
- Take only trades that match the rules, at the smallest size, each with a stop loss.
- Screenshot the chart at entry and at exit, with a one-line note.
- After 30 trades, count how many followed the rules and look at what the losers had in common.
You can also practise without trading. Scroll back a few months on the 4-hour chart, cover the right-hand side of the screen with a sheet of paper, and slide it along one candle at a time, writing down what you would do at each pattern before you uncover the next candle. It is slow, and it shows quickly how often a good-looking pattern leads nowhere.
On a phone, candles and two or three horizontal zones are far easier to read than a chart stacked with five indicators.
What to do next
- Open a demo on the platform you’d use live; our trading platforms guide shows how to install MetaTrader 5 and place a practice order.
- Learn only the doji, hammer, shooting star, engulfing pattern and inside bar this month.
- Every Sunday evening, draw support and resistance zones on one daily chart, then compare them with what the price did that week.
- Size every practice trade with the lot size calculator and check the economic calendar before each session.
- If you’re tempted to skip the learning and follow someone else’s trades, read copy trading explained and forex signal scams first.
Common questions
Which candlestick patterns should beginners learn first?
Start with five: the doji, the hammer, the shooting star, the engulfing pattern and the inside bar. They are easy to spot and appear on every timeframe. None of them is reliable on its own, so learn where they tend to matter, at support, at resistance and in the direction of the trend, before you think about trading them.
What is price action trading?
Price action trading means making decisions from the price chart itself, using candles, support and resistance and the trend, with few or no indicators. It sounds simple but takes a lot of screen time to apply consistently. Like any method, it produces losing trades, and a price action setup is a probability, not a promise.
How do you find support and resistance levels?
Look for prices where the market has turned more than once, then draw a zone around them rather than a single line. Start on the daily or 4-hour chart, where levels are clearer, and note round numbers such as 1.1000 on EURUSD. Expect the price to poke through a level now and then without the level really breaking.
Do candlestick patterns actually work?
They describe accurately what happened during a period of trading, but they don't predict what happens next with any certainty. Many patterns fail, especially on short timeframes, in quiet hours and around news releases. Traders who use them combine them with levels, the trend and a fixed stop loss, and accept that a share of their trades will lose.
What is technical analysis in forex?
Technical analysis is the study of past price movements on a chart to judge where the price might go and where a trade idea would be proved wrong. It uses candlesticks, support and resistance, trendlines and indicators such as moving averages, RSI and MACD. It deals in probabilities and can't account for surprise news.
Which timeframe is best for candlestick patterns?
Patterns on the 4-hour and daily charts are built from more trading and tend to be less noisy than those on 1-minute or 5-minute charts. Short timeframes give you more patterns, but more of them fail. Many traders check a higher timeframe for the trend first, then look for a pattern on a lower one.